Tuesday, December 24, 2013

December 2013 expiration Wrap-up

Updated: 12/24/13

Trades closed in the month of December:

# of Trades = 7
Total Profit = $10
# of Wins = 5 for $261, avg win = $52.20
# of Losses = 2 for -$251, avg loss = -$125.50
Total Risk = 1634
Total ROR = 0.6%
Avg Days in Trade = 15.7
Annualized Return = 14.9%

Friday, December 20, 2013

TOS Tip: IV Rank plot/labels with SD expected moves

12/20/13

TastyTrade Game Changers has done it again. I've been wanting to plot IV Rank but it seemed way too difficult. It turns out that the plot for IV Rank looks just like the plot for ImpVolatility; only the scale is different. Duh! (Actually, want I really want is a weighted plot. Maybe later.) They threw some threshold lines on it, slapped on some labels, and even sprinkled on a few SD move labels to spice it up. Of course, I had to hot rod it a bit.


Sunday, December 15, 2013

TT - Trading Guidelines (notes by Doug W)

All below from TT Market Measures episodes, except where noted:

Strategy Selection (Sosnoff recommendations) - 19 JUL 2013
When IV Rank is high, strategies to consider:
·         Sell Strangles (higher return on capital with less capital)
·         Sell Iron Condors
·         Sell Iron Fly
·         Sell Verticals
·         Covered Calls (higher return on capital with less capital)
·         Naked Puts (higher return on capital with less capital)
In low IV environment, focus on underlyings with high IV and widen out strikes.
If IV Rank is low, strategies that benefit from volatility expansion are:
·         Double Diagonals
·         Pair trades (allows to extend duration while reducing the risk)
·         Bearish directional
·         Debit put spread (ITM/OTM)
POP and ROC considerations:
Place high POP trades while attempting to maximize ROC.  Weighted average of portfolio POP of around 65%-75%.

Tuesday, December 10, 2013

Custom Column: Days Until Earnings

12/10/13


This custom quote displays the number of days until earnings (shown above in the last column). If earnings are after market close then it adds .5 to the number; otherwise, it ends in .0 when earnings are before market open.

Friday, December 6, 2013

TT - WDIS: Strategy Checklist, 12/06/13


Zero Cost Collar

"A collar is an option strategy that limits the range of possible positive or negative returns on an underlying to a specific range." In other words, a collar will protect an investment against drastic downside movement by sacrificing some gains from a drastic upside movement.

A collar consists of 3 positions:
  • A long underlying
  • A long OTM Put (called the "floor")
  • A short OTM Call (called the "cap")

By collecting more for the short call than it costs for the long put, the collar costs you nothing, and can even bring in a credit.

Suppose you owned 100 shares of TSLA, with a cost basis of $120. You believe in TSLA and are very bullish long-term. Now, suppose that TSLA is trading over $140 and you'd like to protect yourself in case the price drops.


Wednesday, December 4, 2013

COST Potential trades, 12/04/13

12/4/13

COST reports earnings 12/11/13 before market open. 


It has been channeling very nicely for the past year. For the past week it has been retracing from the upper resistance, and is about 1/3 from the top. As the channel is drawn, resistance will be 129.50 and support will be 118 at Jan exp.

TOL Potential trades, 12/04/13

12/4/13

TOL reports earnings on 12/10 before market open.


It's showing 1-year support at 30.25 and 6-month resistance at 35.

Sunday, December 1, 2013

November 2013 Wrap-Up

12/1/13

Trades closed in the month of November:

# of Trades = 12
Total Profit = $627.50
# of Wins = 10 for $1239.50, avg win = $123.95
# of Losses = 2 for -$612, avg loss = $306
Total Risk = 3350
Total ROR = 19%
Avg Days in Trade = 7
Annualized Return = 8480%!!!

Sunday, November 24, 2013

TOS Tip: Adjusting Cost Basis in TOS Risk Profile

11/24/13

When analyzing a position with Thinkorswim's Risk Profile it isn't accurate if you modified the original trade by rolling, closing half an iron condor, etc. For example, below is the risk profile for a current position in JCP.

  • BTO +10 Jan14 11 C
  • STO -10 Dec13 8 P


It shows I am currently up $170, with a max profit of $190 at Jan expiration if JCP stays between 8 and 11. This is confirmed by checking the closing order, which would be a debit of $20. However, TOS is ignoring my original trade and that I rolled the short puts.

Friday, November 22, 2013

TT - MM: Scaling into Strength, 11/22/13

TastyTrade - Market Measures

Take-away:

If we enter a trade based on high IV Rank, and the IV Rank continues to rise, does this warrant scaling the position by selling more premium?
  • Entry: past 5 years in FXE, IWM, and TLT
    • IV Rank > 50%
    • Sell 1SD strangle w/45DTE
    • If IV Rank increases by 10 (say, from 55% to 65%) sell another 1SD strangle

  • Results: In these non-stock (indexes) examples it paid off 28 out of 29 times to scale in.

JCP Leap

9/30/13 -Open

With JCP down -35% in the past 2 weeks, and dipping below $9 for the first time in 13 years it's time to buy into weakness.


The IV is 101% with a recent range of 48-116%. That places the current IV in the 78%-tile (101-48)/(116-48). So we'll collect some of the inflated premiums in the puts and use the credit to help finance a LEAP.
  • JCP @8.81
  • BTO +10 Jan 11 C
  • STO -10 Nov 8 P
  • Debit = 0.16 * 10 = $160

Monday, November 18, 2013

TT - MM: Duration and Volatility, 11/18/13

TastyTrade - Market Measures

Take away:

  • Entry: IWM, XLE, EEM, GLD, and EWZ
    • Sell 1SD strangle when IV Rank crosses above 80%
    • Compare 18 DTE and 45 DTE
  • Exit: Manage trades at 25%, 50%, and 75% of max profit
    • Compare to staying in until expiration


Saturday, November 16, 2013

IV Rank Strategies

High IV Rank - over 50%


  • Sell premium and bank on vol contraction
  • Short OTM credit spreads
  • If bullish, short put spreads
  • If bearish, short call spreads
  • If neutral, short strangles and iron condors

Low IV Rank - under 50%


  • Buy premium and bank on vol expansion
  • OTM debit spreads have negative time decay!
  • Buy ATM debit spreads for less than intrinsic value to see positive theta

Friday, November 15, 2013

TT - MM: High Probability Strangles, 11/15/13

TastyTrade - Market Measures

Takeout:

When making high probability trades in large indices with high IV Rank, how do we manage winners based on P/L per day?
  • Entry: 5 years in SPX, NDX, and RUT
    • IV Rank above 50%
    • Sold a 2SD Strangle (97.5% OTM)
  • Exit:
    • 25%, 50%, and 75% of max profit
    • Compared to closing day prior to expiration to avoid assignment
  • NDX had highest P/L-per-day at 25%
  • RUT had highest P/L-per-day at 50%, but only slightly more than at 25%
  • SPX had highest P/L-per-day at 25%
  • Short strangles tie up lots of capital so managing winners at 25% returns the highest P/L-per-day and reduces the number of days in trade
  • If you don't need to free up the capital, let these high probability trades run!

Thursday, November 14, 2013

TT - MM: Chicken Iron Condors, 11/14/13

TastyTrade - Market Measures

Take-out:

This strategy only works at earnings and for high priced stocks. For lower priced equities the short strikes get too tight and it's hard to collect enough premium.
  • Entry: 2 years in AAPL, NFLX, AMZN, GOOG, and MA
    • High IV Rank (above 50%)
    • Sell iron condor 1 day before earnings
    • Compare:
      • Collect 45-50% of the width of the strikes (risk = 50-55%)
      • Collect 33% of the width (risk = 67%)
      • Sell shorts at 1SD (risk = 84%)
  • Exit:
    • Close (BTC) 1 day after earnings

Note: Increasing the credit taken in reduces the risk (possible loss) but also decreases the probability of success.


When used in the appropriate situations this strategy outperformed the 'standard' strategies in P/L, drawdown, and expected winners. Collecting 50% of the strikes should have resulted in a 50% success rate and yet was actually profitable 60% of the time. (1SD iron condors have an expected success rate of 68.2% while the 33% trades should win 67% of the time)

Wednesday, November 13, 2013

NTAP Earnings Play

11/13/31 -Closed


  • Iron Condor, NTAP @41.23
  • STO -1 Nov 43/44C 39/38P
  • Credit = .37
  • Risk =  63
  • ROR = 58% in 2 days


11/15/13 Update:

  • NTAP @41.15
  • BTC +5 Nov 39P
  • Debit = .01
  • Net = $36, 56% in 2 days

CRM Earnings Play

11/13/13

CRM reports earnings on 11/18. Here are some possible trade setups. Unfortunately, there aren't any Nov4 strikes between 61 and 65. I will wait until closer to earnings before entering any of the trades. The strikes may have to move and the IV should go up.

First, an IC with $1 wide strikes. Since 61 is the highest $1 strike it has a high chance of being tested on the top.
  • Iron Condor, CRM @ 57.13
  • STO Nov4 60/61C 53/52P
  • Credit = 0.50
  • Risk = 50
  • ROR = 100% in 9 days
  • BE = 52.50 & 60.50

WMT Earnings Play

11/13/13

WMT reports earnings tomorrow before market open. Current IV Rank is low at 41% which is keeping premiums low. Looking back at movement-after-earnings for the past 2 years the stock dropped 6 times while only gaining twice. Here's a possible bearish IC with the expected move shown below.

  • Credit = 0.35
  • Risk = 65
  • ROR = 54% in 2 days

Tuesday, November 12, 2013

ADBE High IV Rank

11/12/13 -Closed

ADBE has an IV Rank of 95% so we are looking for a vol contraction. We'll be entering a Dec IC with 38DTE. By tightening the call side slightly we can increase our credit, reduce our risk, and give the IC a slightly bearish bias.

  • Iron Condor, ADBE @56.02
  • STO Dec 57.5 C
  • BTO Dec 60 C
  • STO Dec 52.5 P
  • STO Dec 50 P
  • Credit = 1.20
  • Risk = 130
  • ROR = 92%
  • BE = 51.30, 58.70

KSS Earnings Play

11/12/13 -Closed

KSS reports earnings on 11/14 before market open. The IV Rank is over 90% and the expected move of +/-2.83 by expiration is represented on the risk profile below. As you can see the break-even price levels are outside the expected move. NOV option vol should contract from 59% down to 28%.

  • Iron Condor, KSS @57.33
  • STO Nov 60 C (75% OTM)
  • BTO Nov 62.5 C
  • STO Nov 55 P (75% OTM)
  • BTO Nov 52.5 P
  • Credit = 0.72
  • Risk = 178
  • ROR = 40%
  • BE = 54.28, 60.72

Update: 11/14/13

KSS opened -$4.65, ouch. Roll the puts and let the calls expire.
  • Roll, KSS @54.18
  • STO Dec 55/52.5P Nov 55/52.5P
  • Credit = .17

Update: 12/18/13

  • BTC Dec 55/52.5P @0.59
  • Net = $30
  • ROR = 17% in 36 days

Monday, November 11, 2013

RAX Earnings Play

11/11/13 -Closed

Here's an Iron Condor based on an earnings play in RAX.


The screen capture is from the morning after (cha-ching!) so ignore the P/L and volatility figures. The price slices represent the MMM of +/-5.29, while a volatility contraction of 75 points is expected (130% to 55%).
  • Iron Condor, RAX @49.14
  • STO -1 Nov 55 C (80% OTM)
  • BTO +1 Nov 57.5 C
  • STO -1 Nov 42.5 P (84% OTM)
  • BTO +1 Nov 40 P
  • Credit = 0.70
  • Risk = 180
  • ROR = 39% in 4 days

11/15/13 Update

Closed at 50% max profit.
  • BTC Nov 42.5/40P @ .35
  • Net = $35, 19% in 4 days

TT - MM: High IV Rank Occurrence, 11/11/13


  • High IV Rank Strategies:
    • short strangle
    • short iron condor
    • short iron butterfly
    • short vertical
    • naked put
  • Low IV Rank Strategies:
    • put debit spread (ITM/OTM)
    • calendar
    • double diagonal

How often does High IV Rank occur?

Wednesday, November 6, 2013

TT - MM: IV Rank and Managing Winners, 11/06/13

Carry-out:

  • Entry: look at AAPL and GOOG back to 2008, PCLN back to 2010
    • High IV Rank (> 50%)
    • Sold Big Boy Iron Condor w/45DTE
      • Short strikes at 84% OTM
      • Wings are 20 points out ($20 spreads)
  • Exit:
    • 25%, 50%, and 75% of max profit
    • Compare to holding until expiration
    • If target wasn't reached the position was held until expiration
    • Determine drop in IV Rank over length of trade

  • Close at 25% to maximize P/L-per-day and free up capital
  • Close at 50% to maximize P/L and reduce losers
  • No reason to hold longer (unless perhaps IC is centered and POT of shorts is very low)

Tuesday, November 5, 2013

PCLN Earnings Play

11/5/13

This is an earnings play on PCLN. We got in a little early because the premium was so good. IV for the NOV2 weeklys is 78% and should drop to around 34% after earnings on 11/7. The expected move of 65 points by expiration is shown on the risk profile.

TT - MM: Iron Condors - How Much Premium, 11/05/13

TastyTrade - Market Measures

Carry-out:

  • Entry: look back 5 years in AMZN, GOOG, and SBUX
    • High IV Rank (> 50%)
    • Sell Iron Condor w/45DTE:
      • Collect 33% and 45% width of the spreads
      • Compare to 1SD IC
  • Exit: hold until expiration
  • The risk on an iron condor is inversely related to the reward (credit taken in).
  • During high IV rank the 1SD strikes are too conservative and carry too much risk in extreme cases.
  • Sweetspot for high IV Rank Iron Condor:
    • IV Rank above 50%
    • 45DTE
    • 45% Credit

Monday, November 4, 2013

thinkScript: Custom Quote - Strength or Weakness Indicator

Updated 11/04/13

Use this custom quote to highlight stocks showing strength or weakness. '2wk %' will turn green when a stock has a 10% gain in 2 weeks, and turn red for a 10% loss.

Here's how it looks if you use the default black background:

and here's how it looks with the metal background:

Instructions for using this code can be found here: TOS Tip: Custom Quotes


####begin custom quote: 2wk %
#
# Displays the greater up or down price change over the last 2 weeks. 10% or greater = Green. -10% or less = Red.
#
# by John Latrobe
# revised 11/04/13
#
# length is # of trading days. 10 = 2 weeks.
def length = 10;
def price = FundamentalType.CLOSE;
def pricePercentUP = 10.0;
def pricePercentDOWN = -10.0;
#
def priceday = Fundamental(price, period = aggregationPeriod.DAY);
def high = Highest(priceday[1], length);
def low = Lowest(priceday[1], length);
def PcntChHigh = 100 * (priceday/high -1);
def PcntChLow = 100 * (priceday/low -1);
#
plot PercentChg = if(AbsValue(PcntChHigh) >= AbsValue(PcntChLow), Round(PcntChHigh, 2), Round(PcntChlow, 2));
AssignBackgroundColor(if PercentChg >= pricePercentUP then Color.DARK_GREEN else if PercentChg <= pricePercentDOWN then Color.DARK_RED else Color.CURRENT);
PercentChg.AssignValueColor(color.WHITE);
#
#####end quote.

thinkScript: Custom Quote - Daily/Weekly/Monthly Gain or Loss

Updated 11/04/13

Instructions for using this code can be found here: TOS Tip: Custom Quotes

Daily Price change 1 trading day ago:

#####begin custom quote: -Day 1
#
# Shows gain or loss 1 trading day ago for an equity or index.
# GREEN = Gain, RED = Loss.
# Use to customize a column in MarketWatch Quotes or Stock Hacker Scans.
# Paste this code into 1 of the 19 custom fields.
#
# by John Latrobe
# revised 11/04/13
#
DEF price = FundamentalType.CLOSE;
DEF priceday = Fundamental(price, Period = AggregationPeriod.DAY);
#
PLOT pricechg = priceday[1] - priceday[2];
AssignBackgroundColor(if pricechg > 0 then Color.DARK_GREEN else if pricechg < 0 then Color.DARK_RED else Color.CURRENT);
pricechg.AssignValueColor(Color.WHITE);
#
#####end custom quote.

Daily Price change 2 trading days ago:

#####begin custom quote: -Day 2
#
# Shows gain or loss 2 trading days ago for an equity or index.
# GREEN = Gain, RED = Loss.
# Use to customize a column in MarketWatch Quotes or Stock Hacker Scans.
# Paste this code into 1 of the 19 custom fields.
#
# by John Latrobe
# revised 11/04/13
#
DEF price = FundamentalType.CLOSE;
DEF priceday = Fundamental(price, Period = AggregationPeriod.DAY);
#
PLOT pricechg = priceday[2] - priceday[3];
AssignBackgroundColor(if pricechg > 0 then Color.DARK_GREEN else if pricechg < 0 then Color.DARK_RED else Color.CURRENT);
pricechg.AssignValueColor(Color.WHITE);
#
#####end custom quote.

Daily Price change 3 trading days ago:

#####begin custom quote: -Day 3
#
# Shows gain or loss 3 trading days ago for an equity or index.
# GREEN = Gain, RED = Loss.
# Use to customize a column in MarketWatch Quotes or Stock Hacker Scans.
# Paste this code into 1 of the 19 custom fields.
#
# by John Latrobe
# revised 11/04/13
#
DEF price = FundamentalType.CLOSE;
DEF priceday = Fundamental(price, Period = AggregationPeriod.DAY);
#
PLOT pricechg = priceday[3] - priceday[4];
AssignBackgroundColor(if pricechg > 0 then Color.DARK_GREEN else if pricechg < 0 then Color.DARK_RED else Color.CURRENT);
pricechg.AssignValueColor(Color.WHITE);
#
#####end custom quote.

Daily Price change 4 trading days ago:

#####begin custom quote: -Day 4
#
# Shows gain or loss 4 trading days ago for an equity or index.
# GREEN = Gain, RED = Loss.
# Use to customize a column in MarketWatch Quotes or Stock Hacker Scans.
# Paste this code into 1 of the 19 custom fields.
#
# by John Latrobe
# revised 11/04/13
#
DEF price = FundamentalType.CLOSE;
DEF priceday = Fundamental(price, Period = AggregationPeriod.DAY);
#
PLOT pricechg = priceday[4] - priceday[5];
AssignBackgroundColor(if pricechg > 0 then Color.DARK_GREEN else if pricechg < 0 then Color.DARK_RED else Color.CURRENT);
pricechg.AssignValueColor(Color.WHITE);
#
#####end custom quote.

Daily Price change 5 trading days (1 week) ago:

#####begin custom quote: -Day 5
#
# Shows gain or loss 5 trading days ago for an equity or index.
# GREEN = Gain, RED = Loss.
# Use to customize a column in MarketWatch Quotes or Stock Hacker Scans.
# Paste this code into 1 of the 19 custom fields.
#
# by John Latrobe
# revised 11/04/13
#
DEF price = FundamentalType.CLOSE;
DEF priceday = Fundamental(price, Period = AggregationPeriod.DAY);
#
PLOT pricechg = priceday[5] - priceday[6];
AssignBackgroundColor(if pricechg > 0 then Color.DARK_GREEN else if pricechg < 0 then Color.DARK_RED else Color.CURRENT);
pricechg.AssignValueColor(Color.WHITE);
#
#####end custom quote.

Weekly Price change for past week (last 5 trading days):

#####begin custom quote: -Wk 1
#
# Shows gain or loss last 5 trading days for an equity or index.
# GREEN = Gain, RED = Loss.
# Use to customize a column in MarketWatch Quotes or Stock Hacker Scans.
# Paste this code into 1 of the 19 custom fields.
#
# by John Latrobe
# revised 11/04/13
#
DEF price = FundamentalType.CLOSE;
DEF priceday = Fundamental(price, Period = AggregationPeriod.DAY);
#
PLOT pricechg = priceday[1] - priceday[6];
AssignBackgroundColor(if pricechg > 0 then Color.DARK_GREEN else if pricechg < 0 then Color.DARK_RED else Color.CURRENT);
pricechg.AssignValueColor(Color.YELLOW);
#
#####end custom quote.

Weekly Price change 2 weeks ago (trading days -10 thru -6):

#####begin custom quote: -Wk 2
#
# Shows gain or loss for week ending 6 trading days ago (days -10 thru -6) for an equity or index.
# GREEN = Gain, RED = Loss.
# Use to customize a column in MarketWatch Quotes or Stock Hacker Scans.
# Paste this code into 1 of the 19 custom fields.
#
# by John Latrobe
# revised 11/04/13
#
DEF price = FundamentalType.CLOSE;
DEF priceday = Fundamental(price, Period = AggregationPeriod.DAY);
#
PLOT pricechg = priceday[6] - priceday[11];
AssignBackgroundColor(if pricechg > 0 then Color.DARK_GREEN else if pricechg < 0 then Color.DARK_RED else Color.CURRENT);
pricechg.AssignValueColor(Color.YELLOW);
#
#####end custom quote.

Weekly Price change 3 weeks ago (trading days -15 thru -11):

#####begin custom quote: -Wk 3
#
# Shows gain or loss for week ending 11 trading days ago (days -15 thru -11) for an equity or index.
# GREEN = Gain, RED = Loss.
# Use to customize a column in MarketWatch Quotes or Stock Hacker Scans.
# Paste this code into 1 of the 19 custom fields.
#
# by John Latrobe
# revised 11/04/13
#
DEF price = FundamentalType.CLOSE;
DEF priceday = Fundamental(price, Period = AggregationPeriod.DAY);
#
PLOT pricechg = priceday[11] - priceday[16];
AssignBackgroundColor(if pricechg > 0 then Color.DARK_GREEN else if pricechg < 0 then Color.DARK_RED else Color.CURRENT);
pricechg.AssignValueColor(Color.YELLOW);
#
#####end custom quote.

Weekly Price change 4 weeks ago (trading days -20 thru -16):

#####begin custom quote: -Wk 4
#
# Shows gain or loss for week ending 16 trading days ago (days -20 thru -16) for an equity or index.
# GREEN = Gain, RED = Loss.
# Use to customize a column in MarketWatch Quotes or Stock Hacker Scans.
# Paste this code into 1 of the 19 custom fields.
#
# by John Latrobe
# revised 11/04/13
#
DEF price = FundamentalType.CLOSE;
DEF priceday = Fundamental(price, Period = AggregationPeriod.DAY);
#
PLOT pricechg = priceday[16] - priceday[21];
AssignBackgroundColor(if pricechg > 0 then Color.DARK_GREEN else if pricechg < 0 then Color.DARK_RED else Color.CURRENT);
pricechg.AssignValueColor(Color.YELLOW);
#
#####end custom quote.

Monthly Price change for past month (last 21 trading days):

#####begin custom quote: -Mo 1
#
# Shows gain or loss for past month (trading days -21 thru -1) for an equity or index.
# -Mo 2 would use trading days -42 thru -22, etc.
# GREEN = Gain, RED = Loss.
# Use to customize a column in MarketWatch Quotes or Stock Hacker Scans.
# Paste this code into 1 of the 19 custom fields.
#
# by John Latrobe
# revised 11/04/13
#
DEF price = FundamentalType.CLOSE;
DEF priceday = Fundamental(price, Period = AggregationPeriod.DAY);
#
PLOT pricechg = priceday[1] - priceday[22];
AssignBackgroundColor(if pricechg > 0 then Color.DARK_GREEN else if pricechg < 0 then Color.DARK_RED else Color.CURRENT);
pricechg.AssignValueColor(Color.WHITE);
#
#####end custom quote.

October 2013 Wrap-up

# of Trades = 5
Total Risk = 2584
Total Profit = $427
Total ROR = 16.5%

Tuesday, October 29, 2013

FB Earnings Play

10/29/31

FB earnings come out on 10/30 after market close. We are looking to place a non-bias iron condor that capitalizes on the expected volatility contraction. I accidentally placed this trade a day earlier than I intended, so we'll see if this makes a difference.

YELP Earnings Play

10/29/13

YELP earnings get reported today after market close.


LNKD Earnings Play

10/29/13

LNKD earnings come today right after market close, so we are looking to setup an earnings play.


Monday, October 28, 2013

TT - BP: Volatility Expansion, 10/28/13

Volatility

  • Q:  What does Implied Volatility (IV) represent?
  • A:  IV represents a 1 Standard Deviation (1SD) move in the underlying for the next year. It is displayed as a percentage, meaning if AAPL has an IV of 0.3 then a 1SD move would be 30%. If AAPL is currently trading at $500 then it would have an expected move of +/- $150.

  • Q:  Can IV be used to estimate moves of an underlying on a shorter time frame than 1 year?
  • A:  Yes.  1SD Move = Price * IV * SquareRoot(DTE/365)
Using the above example of AAPL, the expected 1SD move in one month would be:
500 * 0.3 * SqRt(30/365) = $43

  • Q:  What is the relevance of a 19.1% IV?
  • A:  A 19.1% IV represents an expected move of 1% per day. Twice that IV, or 38.2%, means a 2% expected daily move.

  • Q:  What is Realized Volatility?
  • A:  Realized Volatility refers to the actual move of the underlying.
If AAPL (trading at $500 with an IV of 0.3) moves $100 in one year then its volatility is 0.2 (100/500) or 20%.

  • Q:  What is IV Rank and how is it used?
  • A:  IV Rank (or IV Percentile) shows where the IV currently sits in relation to a specific time period (usually one year). We have seen that IV is consistently a mean reverting metric and IV Rank allows us to capture this, putting it on a comparable scale. We look for underlying with high IV Rank to sell premium.

  • Q:  What is the significance of Implied Volatility for each option expiration cycle?
  • A:  The IV on a specific option cycle represents the given IV for that time period (expiration cycle). The IV on any given option chain will often appear similar to one another and the overall IV of the underlying. A vol discrepancy will often appear on the closest expiration after binary events, such as earnings.

  • Q:  What is vol skew?
  • A:  Vol skew refers to the fact that volatility and velocity is greater to the downside. Skew builds extra premium into the OTM put when compared to the equivalent OTM call. For this the options pricing model is based on a lognormal distribution, as a stock price cannot fall below zero.

Sunday, October 27, 2013

thinkScript: Price Percent chart label

A useful indicator or strength or weakness in an equity is when the price moves up or down 10% in 2 weeks. For indexes this change is 5%.


This Chart label compares the current price with the high and low for the past specified period (default is 2 weeks) and displays the maximum price change. When the default threshold of +/- 5% is reached the label will turn red for a loss and green for a gain.


####begin study: TT_PricePercent
#
# Hint: From TastyTrade. Takes the high and low close for the specified period and compares to the current. The greater change is displayed as a percentage in a label.
#
# length is # of trading days. 10 = 2 weeks.
input length = 10;
input price = FundamentalType.CLOSE;
input pricePercentUP = 5.0;
input pricePercentDOWN = -5.0;
#
def priceday = Fundamental(price, period = aggregationPeriod.DAY);
def high = Highest(priceday[1], length);
def low = Lowest(priceday[1], length);
def PcntChHigh = 100 * (priceday/high -1);
def PcntChLow = 100 * (priceday/low -1);
def PercentChg = if(AbsValue(PcntChHigh) >= AbsValue(PcntChLow), Round(PcntChHigh, 2), Round(PcntChlow, 2));
#
AddLabel(1, Concat ("% Chng: ", PercentChg),if percentChg >= pricePercentUP then color.DARK_GREEN else if percentChg <= pricePercentDOWN then color.RED else color.GRAY);
#
#####end study.

Thursday, October 17, 2013

UNH Debit Spread

10/17/13 -Closed

This is a post-earnings trade on UNH. After dropping this morning from yesterday's close of 75.19 we decided to buy into the slight pullback.
  • Vertical Debit Spread, UNH @ 71.31
  • BTO +1 Nov 67.5 C
  • STO -1 Nov 70 C
  • Debit = 1.95
  • Risk = 195
  • BE = 69.45
  • ROR = 55 / 195 = 28%

Update: 11/14/13

  • STC Nov 67.5/70C @2.45
  • Net = $50
  • ROR = 25% in 28 days


Monday, October 14, 2013

TOS Tip: Custom Quotes

Thinkorswim allows 19 custom quotes for use as customized columns. They can be used on the Trade tab, Stock Hacker Scans, and Market Watch Quotes.


In order to use the Custom Quotes you must first be on one of the screens that support them. Right-click on any column heading and select Customize.


Type 'custom' in the search box that says 'Lookup a column...' This will filter out all but your custom columns, even ones that you rename.


Click the scroll icon for the custom column you want to edit. Click on the thinkScript Editor tab and delete any code that exists. Copy the desired code and paste it on line 1. Fill in the Column name to match.


After customizing each column they must be added to the current display set. You'll probably have to remove some of the existing columns to make room. Make sure that you save the Workspace so that your customizations are easily recalled.


Thursday, October 10, 2013

NFLX High IV Rank

10/10/13

This is a purely high IV play. With the 2-month IV Rank at 98%, the inflated premiums offer up a nice Iron Condor. Normally this type of trade is opened around the 1st of the month so there are 45 DTE (days to expiration), but at that time the IV was 15 points lower.


  • Iron Condor, NFLX @ 305.80
  • STO -1 Nov 390 Call
  • BTO +1 Nov 400 Call
  • STO -1 Nov 215 Put
  • BTO +1 Nov 205 Put
  • Credit = 1.47
  • Risk = 853
  • ROR = 147 / 853 = 17% in 36 days


Wednesday, October 2, 2013

PCLN Iron Condor

10/2/13

Today was our first meeting of the Humpday Traders.

This first trade started with a recommendation from Dinger.
PCLN @ 1067.00
STO NOV 1205 CALLS for a nice credit.
If you can't go naked or don't want to....you could consider:
STO NOV 1205 C and BTO NOV 1220 C for a solid credit.
After looking at the chart, we see that the current IV percentile is 50% compared to the past year, 77% for the past 4 months, and 100% for the past month. As a side note, TastyTrade is now referring to 'current IV percentile' as 'IV rank' in order to avoid the confusion with current IV. With the monthly IV rank at 100% we can cash in on the high premiums by add a credit Put spread to Dinger's Call spread to create an Iron Condor. The high IV rank also allows us to move farther OTM to the 90% strikes. This morning with PCLN @ 1056 I placed an order to sell an IC for $1.70.
  • Iron Condor, PCLN @ 1056
  • STO -1 Nov 1210 C
  • BTO +1 Nov 1220 C
  • STO -1 Nov 895 P
  • BTO +1 Nov 885 P
  • Credit = 1.70
  • Risk = 830
  • ROR = 170 / 830 = 20%

Monday, September 9, 2013

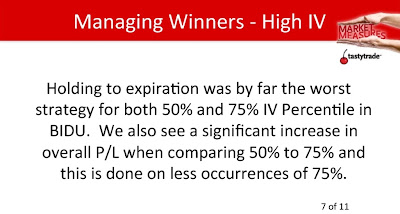
TT - MM: Managing Winners - High IV, 9/09/13

Take-away:

  • Entry: past 5 years in AMZN and BIDU
    • Sell 1SD Strangle w/45DTE
    • IV Rank > 50%
    • IV Rank > 75%
  • Exit:
    • Close at 25%, 50%, and 75% of max profit
    • Compare to holding until expiration
    • If target % is not reached hold until expiration

  • Waiting for 75% IV Rank greatly increases the average P/L-per-day.
  • Holding until expiration did not return the highest profit and was nearly the lowest average P/L-per-day.