TastyTrade - Best Practices
Monday, November 25, 2013

Sunday, November 24, 2013
TOS Tip: Adjusting Cost Basis in TOS Risk Profile
11/24/13
When analyzing a position with Thinkorswim's Risk Profile it isn't accurate if you modified the original trade by rolling, closing half an iron condor, etc. For example, below is the risk profile for a current position in JCP.- BTO +10 Jan14 11 C
- STO -10 Dec13 8 P

It shows I am currently up $170, with a max profit of $190 at Jan expiration if JCP stays between 8 and 11. This is confirmed by checking the closing order, which would be a debit of $20. However, TOS is ignoring my original trade and that I rolled the short puts.
Friday, November 22, 2013
TT - MM: Scaling into Strength, 11/22/13
TastyTrade - Market Measures


Take-away:
If we enter a trade based on high IV Rank, and the IV Rank continues to rise, does this warrant scaling the position by selling more premium?
- Entry: past 5 years in FXE, IWM, and TLT
- IV Rank > 50%
- Sell 1SD strangle w/45DTE
- If IV Rank increases by 10 (say, from 55% to 65%) sell another 1SD strangle


- Results: In these non-stock (indexes) examples it paid off 28 out of 29 times to scale in.
JCP Leap
9/30/13 -Open
With JCP down -35% in the past 2 weeks, and dipping below $9 for the first time in 13 years it's time to buy into weakness.

The IV is 101% with a recent range of 48-116%. That places the current IV in the 78%-tile (101-48)/(116-48). So we'll collect some of the inflated premiums in the puts and use the credit to help finance a LEAP.
- JCP @8.81
- BTO +10 Jan 11 C
- STO -10 Nov 8 P
- Debit = 0.16 * 10 = $160
Monday, November 18, 2013
TT - MM: Duration and Volatility, 11/18/13
TastyTrade - Market Measures

Take away:
- Entry: IWM, XLE, EEM, GLD, and EWZ
- Sell 1SD strangle when IV Rank crosses above 80%
- Compare 18 DTE and 45 DTE
- Exit: Manage trades at 25%, 50%, and 75% of max profit
- Compare to staying in until expiration
Saturday, November 16, 2013
IV Rank Strategies
High IV Rank - over 50%
- Sell premium and bank on vol contraction
- Short OTM credit spreads
- If bullish, short put spreads
- If bearish, short call spreads
- If neutral, short strangles and iron condors
Low IV Rank - under 50%
- Buy premium and bank on vol expansion
- OTM debit spreads have negative time decay!
- Buy ATM debit spreads for less than intrinsic value to see positive theta
Friday, November 15, 2013
TT - MM: High Probability Strangles, 11/15/13
TastyTrade - Market Measures


Takeout:
When making high probability trades in large indices with high IV Rank, how do we manage winners based on P/L per day?
- Entry: 5 years in SPX, NDX, and RUT
- IV Rank above 50%
- Sold a 2SD Strangle (97.5% OTM)
- Exit:
- 25%, 50%, and 75% of max profit
- Compared to closing day prior to expiration to avoid assignment
- NDX had highest P/L-per-day at 25%
- RUT had highest P/L-per-day at 50%, but only slightly more than at 25%
- SPX had highest P/L-per-day at 25%
- Short strangles tie up lots of capital so managing winners at 25% returns the highest P/L-per-day and reduces the number of days in trade
- If you don't need to free up the capital, let these high probability trades run!
Thursday, November 14, 2013
TT - MM: Chicken Iron Condors, 11/14/13
TastyTrade - Market Measures
Note: Increasing the credit taken in reduces the risk (possible loss) but also decreases the probability of success.

When used in the appropriate situations this strategy outperformed the 'standard' strategies in P/L, drawdown, and expected winners. Collecting 50% of the strikes should have resulted in a 50% success rate and yet was actually profitable 60% of the time. (1SD iron condors have an expected success rate of 68.2% while the 33% trades should win 67% of the time)
Take-out:
This strategy only works at earnings and for high priced stocks. For lower priced equities the short strikes get too tight and it's hard to collect enough premium.- Entry: 2 years in AAPL, NFLX, AMZN, GOOG, and MA
- High IV Rank (above 50%)
- Sell iron condor 1 day before earnings
- Compare:
- Collect 45-50% of the width of the strikes (risk = 50-55%)
- Collect 33% of the width (risk = 67%)
- Sell shorts at 1SD (risk = 84%)
- Exit:
- Close (BTC) 1 day after earnings
Note: Increasing the credit taken in reduces the risk (possible loss) but also decreases the probability of success.

When used in the appropriate situations this strategy outperformed the 'standard' strategies in P/L, drawdown, and expected winners. Collecting 50% of the strikes should have resulted in a 50% success rate and yet was actually profitable 60% of the time. (1SD iron condors have an expected success rate of 68.2% while the 33% trades should win 67% of the time)
Wednesday, November 13, 2013
NTAP Earnings Play
11/13/31 -Closed

- Iron Condor, NTAP @41.23
- STO -1 Nov 43/44C 39/38P
- Credit = .37
- Risk = 63
- ROR = 58% in 2 days
11/15/13 Update:
- NTAP @41.15
- BTC +5 Nov 39P
- Debit = .01
- Net = $36, 56% in 2 days
CRM Earnings Play
11/13/13
CRM reports earnings on 11/18. Here are some possible trade setups. Unfortunately, there aren't any Nov4 strikes between 61 and 65. I will wait until closer to earnings before entering any of the trades. The strikes may have to move and the IV should go up.
First, an IC with $1 wide strikes. Since 61 is the highest $1 strike it has a high chance of being tested on the top.

- Iron Condor, CRM @ 57.13
- STO Nov4 60/61C 53/52P
- Credit = 0.50
- Risk = 50
- ROR = 100% in 9 days
- BE = 52.50 & 60.50
WMT Earnings Play
11/13/13
WMT reports earnings tomorrow before market open. Current IV Rank is low at 41% which is keeping premiums low. Looking back at movement-after-earnings for the past 2 years the stock dropped 6 times while only gaining twice. Here's a possible bearish IC with the expected move shown below.

- Credit = 0.35
- Risk = 65
- ROR = 54% in 2 days
Tuesday, November 12, 2013
ADBE High IV Rank
11/12/13 -Closed
ADBE has an IV Rank of 95% so we are looking for a vol contraction. We'll be entering a Dec IC with 38DTE. By tightening the call side slightly we can increase our credit, reduce our risk, and give the IC a slightly bearish bias.

- Iron Condor, ADBE @56.02
- STO Dec 57.5 C
- BTO Dec 60 C
- STO Dec 52.5 P
- STO Dec 50 P
- Credit = 1.20
- Risk = 130
- ROR = 92%
- BE = 51.30, 58.70
KSS Earnings Play
11/12/13 -Closed
KSS reports earnings on 11/14 before market open. The IV Rank is over 90% and the expected move of +/-2.83 by expiration is represented on the risk profile below. As you can see the break-even price levels are outside the expected move. NOV option vol should contract from 59% down to 28%.

- Iron Condor, KSS @57.33
- STO Nov 60 C (75% OTM)
- BTO Nov 62.5 C
- STO Nov 55 P (75% OTM)
- BTO Nov 52.5 P
- Credit = 0.72
- Risk = 178
- ROR = 40%
- BE = 54.28, 60.72
Update: 11/14/13
KSS opened -$4.65, ouch. Roll the puts and let the calls expire.
- Roll, KSS @54.18
- STO Dec 55/52.5P Nov 55/52.5P
- Credit = .17
Update: 12/18/13
- BTC Dec 55/52.5P @0.59
- Net = $30
- ROR = 17% in 36 days
Monday, November 11, 2013
RAX Earnings Play
11/11/13 -Closed
Here's an Iron Condor based on an earnings play in RAX.

The screen capture is from the morning after (cha-ching!) so ignore the P/L and volatility figures. The price slices represent the MMM of +/-5.29, while a volatility contraction of 75 points is expected (130% to 55%).
- Iron Condor, RAX @49.14
- STO -1 Nov 55 C (80% OTM)
- BTO +1 Nov 57.5 C
- STO -1 Nov 42.5 P (84% OTM)
- BTO +1 Nov 40 P
- Credit = 0.70
- Risk = 180
- ROR = 39% in 4 days
11/15/13 Update
Closed at 50% max profit.
- BTC Nov 42.5/40P @ .35
- Net = $35, 19% in 4 days
TT - MM: High IV Rank Occurrence, 11/11/13
- High IV Rank Strategies:
- short strangle
- short iron condor
- short iron butterfly
- short vertical
- naked put
- Low IV Rank Strategies:
- put debit spread (ITM/OTM)
- calendar
- double diagonal
How often does High IV Rank occur?


Wednesday, November 6, 2013
TT - MM: IV Rank and Managing Winners, 11/06/13
Carry-out:
- Entry: look at AAPL and GOOG back to 2008, PCLN back to 2010
- High IV Rank (> 50%)
- Sold Big Boy Iron Condor w/45DTE
- Short strikes at 84% OTM
- Wings are 20 points out ($20 spreads)
- Exit:
- 25%, 50%, and 75% of max profit
- Compare to holding until expiration
- If target wasn't reached the position was held until expiration
- Determine drop in IV Rank over length of trade


- Close at 25% to maximize P/L-per-day and free up capital
- Close at 50% to maximize P/L and reduce losers
- No reason to hold longer (unless perhaps IC is centered and POT of shorts is very low)
Tuesday, November 5, 2013
PCLN Earnings Play
11/5/13
This is an earnings play on PCLN. We got in a little early because the premium was so good. IV for the NOV2 weeklys is 78% and should drop to around 34% after earnings on 11/7. The expected move of 65 points by expiration is shown on the risk profile.

TT - MM: Iron Condors - How Much Premium, 11/05/13
TastyTrade - Market Measures


Carry-out:
- Entry: look back 5 years in AMZN, GOOG, and SBUX
- High IV Rank (> 50%)
- Sell Iron Condor w/45DTE:
- Collect 33% and 45% width of the spreads
- Compare to 1SD IC
- Exit: hold until expiration


- The risk on an iron condor is inversely related to the reward (credit taken in).
- During high IV rank the 1SD strikes are too conservative and carry too much risk in extreme cases.
- Sweetspot for high IV Rank Iron Condor:
- IV Rank above 50%
- 45DTE
- 45% Credit
Monday, November 4, 2013
thinkScript: Custom Quote - Strength or Weakness Indicator
Updated 11/04/13
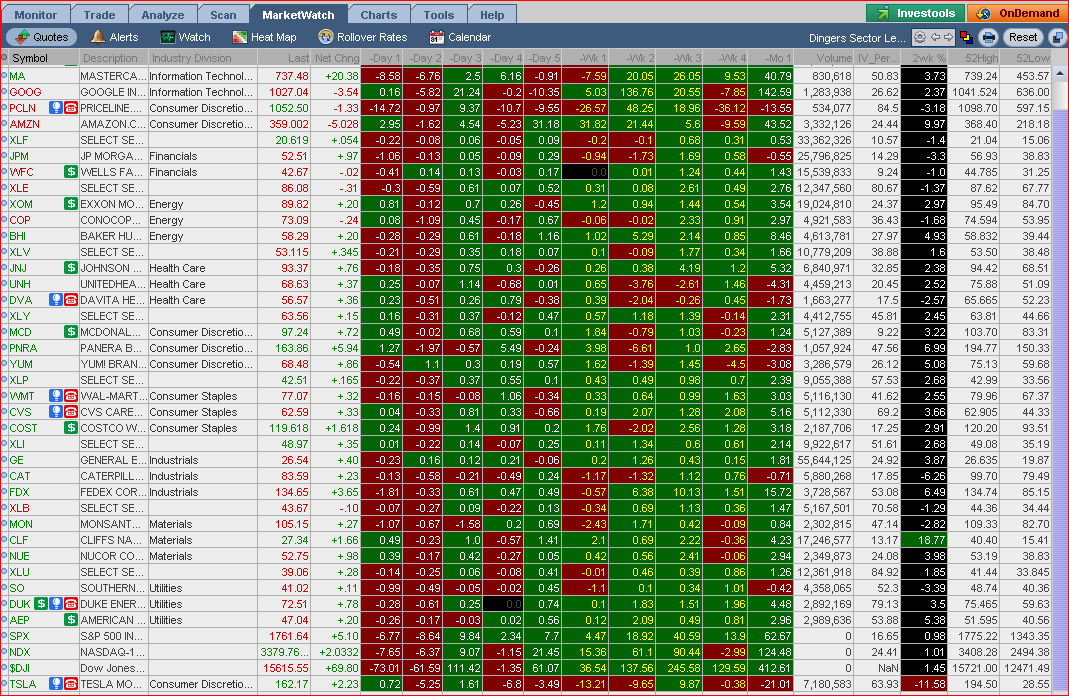
Use this custom quote to highlight stocks showing strength or weakness. '2wk %' will turn green when a stock has a 10% gain in 2 weeks, and turn red for a 10% loss.Here's how it looks if you use the default black background:

and here's how it looks with the metal background:
Instructions for using this code can be found here: TOS Tip: Custom Quotes
####begin custom quote: 2wk %
#
# Displays the greater up or down price change over the last 2 weeks. 10% or greater = Green. -10% or less = Red.
#
# by John Latrobe
# revised 11/04/13
#
# length is # of trading days. 10 = 2 weeks.
def length = 10;
def price = FundamentalType.CLOSE;
def pricePercentUP = 10.0;
def pricePercentDOWN = -10.0;
#
def priceday = Fundamental(price, period = aggregationPeriod.DAY);
def high = Highest(priceday[1], length);
def low = Lowest(priceday[1], length);
def PcntChHigh = 100 * (priceday/high -1);
def PcntChLow = 100 * (priceday/low -1);
#
plot PercentChg = if(AbsValue(PcntChHigh) >= AbsValue(PcntChLow), Round(PcntChHigh, 2), Round(PcntChlow, 2));
AssignBackgroundColor(if PercentChg >= pricePercentUP then Color.DARK_GREEN else if PercentChg <= pricePercentDOWN then Color.DARK_RED else Color.CURRENT);
PercentChg.AssignValueColor(color.WHITE);
#
#####end quote.
thinkScript: Custom Quote - Daily/Weekly/Monthly Gain or Loss
Updated 11/04/13
Instructions for using this code can be found here: TOS Tip: Custom Quotes
#
# Shows gain or loss 1 trading day ago for an equity or index.
# GREEN = Gain, RED = Loss.
# Use to customize a column in MarketWatch Quotes or Stock Hacker Scans.
# Paste this code into 1 of the 19 custom fields.
#
# by John Latrobe
# revised 11/04/13
#
DEF price = FundamentalType.CLOSE;
DEF priceday = Fundamental(price, Period = AggregationPeriod.DAY);
#
PLOT pricechg = priceday[1] - priceday[2];
AssignBackgroundColor(if pricechg > 0 then Color.DARK_GREEN else if pricechg < 0 then Color.DARK_RED else Color.CURRENT);
pricechg.AssignValueColor(Color.WHITE);
#
#####end custom quote.
#
# Shows gain or loss 2 trading days ago for an equity or index.
# GREEN = Gain, RED = Loss.
# Use to customize a column in MarketWatch Quotes or Stock Hacker Scans.
# Paste this code into 1 of the 19 custom fields.
#
# by John Latrobe
# revised 11/04/13
#
DEF price = FundamentalType.CLOSE;
DEF priceday = Fundamental(price, Period = AggregationPeriod.DAY);
#
PLOT pricechg = priceday[2] - priceday[3];
AssignBackgroundColor(if pricechg > 0 then Color.DARK_GREEN else if pricechg < 0 then Color.DARK_RED else Color.CURRENT);
pricechg.AssignValueColor(Color.WHITE);
#
#####end custom quote.
#
# Shows gain or loss 3 trading days ago for an equity or index.
# GREEN = Gain, RED = Loss.
# Use to customize a column in MarketWatch Quotes or Stock Hacker Scans.
# Paste this code into 1 of the 19 custom fields.
#
# by John Latrobe
# revised 11/04/13
#
DEF price = FundamentalType.CLOSE;
DEF priceday = Fundamental(price, Period = AggregationPeriod.DAY);
#
PLOT pricechg = priceday[3] - priceday[4];
AssignBackgroundColor(if pricechg > 0 then Color.DARK_GREEN else if pricechg < 0 then Color.DARK_RED else Color.CURRENT);
pricechg.AssignValueColor(Color.WHITE);
#
#####end custom quote.
#
# Shows gain or loss 4 trading days ago for an equity or index.
# GREEN = Gain, RED = Loss.
# Use to customize a column in MarketWatch Quotes or Stock Hacker Scans.
# Paste this code into 1 of the 19 custom fields.
#
# by John Latrobe
# revised 11/04/13
#
DEF price = FundamentalType.CLOSE;
DEF priceday = Fundamental(price, Period = AggregationPeriod.DAY);
#
PLOT pricechg = priceday[4] - priceday[5];
AssignBackgroundColor(if pricechg > 0 then Color.DARK_GREEN else if pricechg < 0 then Color.DARK_RED else Color.CURRENT);
pricechg.AssignValueColor(Color.WHITE);
#
#####end custom quote.
#
# Shows gain or loss 5 trading days ago for an equity or index.
# GREEN = Gain, RED = Loss.
# Use to customize a column in MarketWatch Quotes or Stock Hacker Scans.
# Paste this code into 1 of the 19 custom fields.
#
# by John Latrobe
# revised 11/04/13
#
DEF price = FundamentalType.CLOSE;
DEF priceday = Fundamental(price, Period = AggregationPeriod.DAY);
#
PLOT pricechg = priceday[5] - priceday[6];
AssignBackgroundColor(if pricechg > 0 then Color.DARK_GREEN else if pricechg < 0 then Color.DARK_RED else Color.CURRENT);
pricechg.AssignValueColor(Color.WHITE);
#
#####end custom quote.
#
# Shows gain or loss last 5 trading days for an equity or index.
# GREEN = Gain, RED = Loss.
# Use to customize a column in MarketWatch Quotes or Stock Hacker Scans.
# Paste this code into 1 of the 19 custom fields.
#
# by John Latrobe
# revised 11/04/13
#
DEF price = FundamentalType.CLOSE;
DEF priceday = Fundamental(price, Period = AggregationPeriod.DAY);
#
PLOT pricechg = priceday[1] - priceday[6];
AssignBackgroundColor(if pricechg > 0 then Color.DARK_GREEN else if pricechg < 0 then Color.DARK_RED else Color.CURRENT);
pricechg.AssignValueColor(Color.YELLOW);
#
#####end custom quote.
#
# Shows gain or loss for week ending 6 trading days ago (days -10 thru -6) for an equity or index.
# GREEN = Gain, RED = Loss.
# Use to customize a column in MarketWatch Quotes or Stock Hacker Scans.
# Paste this code into 1 of the 19 custom fields.
#
# by John Latrobe
# revised 11/04/13
#
DEF price = FundamentalType.CLOSE;
DEF priceday = Fundamental(price, Period = AggregationPeriod.DAY);
#
PLOT pricechg = priceday[6] - priceday[11];
AssignBackgroundColor(if pricechg > 0 then Color.DARK_GREEN else if pricechg < 0 then Color.DARK_RED else Color.CURRENT);
pricechg.AssignValueColor(Color.YELLOW);
#
#####end custom quote.
#
# Shows gain or loss for week ending 11 trading days ago (days -15 thru -11) for an equity or index.
# GREEN = Gain, RED = Loss.
# Use to customize a column in MarketWatch Quotes or Stock Hacker Scans.
# Paste this code into 1 of the 19 custom fields.
#
# by John Latrobe
# revised 11/04/13
#
DEF price = FundamentalType.CLOSE;
DEF priceday = Fundamental(price, Period = AggregationPeriod.DAY);
#
PLOT pricechg = priceday[11] - priceday[16];
AssignBackgroundColor(if pricechg > 0 then Color.DARK_GREEN else if pricechg < 0 then Color.DARK_RED else Color.CURRENT);
pricechg.AssignValueColor(Color.YELLOW);
#
#####end custom quote.
#
# Shows gain or loss for week ending 16 trading days ago (days -20 thru -16) for an equity or index.
# GREEN = Gain, RED = Loss.
# Use to customize a column in MarketWatch Quotes or Stock Hacker Scans.
# Paste this code into 1 of the 19 custom fields.
#
# by John Latrobe
# revised 11/04/13
#
DEF price = FundamentalType.CLOSE;
DEF priceday = Fundamental(price, Period = AggregationPeriod.DAY);
#
PLOT pricechg = priceday[16] - priceday[21];
AssignBackgroundColor(if pricechg > 0 then Color.DARK_GREEN else if pricechg < 0 then Color.DARK_RED else Color.CURRENT);
pricechg.AssignValueColor(Color.YELLOW);
#
#####end custom quote.
Instructions for using this code can be found here: TOS Tip: Custom Quotes
Daily Price change 1 trading day ago:
#####begin custom quote: -Day 1#
# Shows gain or loss 1 trading day ago for an equity or index.
# GREEN = Gain, RED = Loss.
# Use to customize a column in MarketWatch Quotes or Stock Hacker Scans.
# Paste this code into 1 of the 19 custom fields.
#
# by John Latrobe
# revised 11/04/13
#
DEF price = FundamentalType.CLOSE;
DEF priceday = Fundamental(price, Period = AggregationPeriod.DAY);
#
PLOT pricechg = priceday[1] - priceday[2];
AssignBackgroundColor(if pricechg > 0 then Color.DARK_GREEN else if pricechg < 0 then Color.DARK_RED else Color.CURRENT);
pricechg.AssignValueColor(Color.WHITE);
#
#####end custom quote.
Daily Price change 2 trading days ago:
#####begin custom quote: -Day 2#
# Shows gain or loss 2 trading days ago for an equity or index.
# GREEN = Gain, RED = Loss.
# Use to customize a column in MarketWatch Quotes or Stock Hacker Scans.
# Paste this code into 1 of the 19 custom fields.
#
# by John Latrobe
# revised 11/04/13
#
DEF price = FundamentalType.CLOSE;
DEF priceday = Fundamental(price, Period = AggregationPeriod.DAY);
#
PLOT pricechg = priceday[2] - priceday[3];
AssignBackgroundColor(if pricechg > 0 then Color.DARK_GREEN else if pricechg < 0 then Color.DARK_RED else Color.CURRENT);
pricechg.AssignValueColor(Color.WHITE);
#
#####end custom quote.
Daily Price change 3 trading days ago:
#####begin custom quote: -Day 3#
# Shows gain or loss 3 trading days ago for an equity or index.
# GREEN = Gain, RED = Loss.
# Use to customize a column in MarketWatch Quotes or Stock Hacker Scans.
# Paste this code into 1 of the 19 custom fields.
#
# by John Latrobe
# revised 11/04/13
#
DEF price = FundamentalType.CLOSE;
DEF priceday = Fundamental(price, Period = AggregationPeriod.DAY);
#
PLOT pricechg = priceday[3] - priceday[4];
AssignBackgroundColor(if pricechg > 0 then Color.DARK_GREEN else if pricechg < 0 then Color.DARK_RED else Color.CURRENT);
pricechg.AssignValueColor(Color.WHITE);
#
#####end custom quote.
Daily Price change 4 trading days ago:
#####begin custom quote: -Day 4#
# Shows gain or loss 4 trading days ago for an equity or index.
# GREEN = Gain, RED = Loss.
# Use to customize a column in MarketWatch Quotes or Stock Hacker Scans.
# Paste this code into 1 of the 19 custom fields.
#
# by John Latrobe
# revised 11/04/13
#
DEF price = FundamentalType.CLOSE;
DEF priceday = Fundamental(price, Period = AggregationPeriod.DAY);
#
PLOT pricechg = priceday[4] - priceday[5];
AssignBackgroundColor(if pricechg > 0 then Color.DARK_GREEN else if pricechg < 0 then Color.DARK_RED else Color.CURRENT);
pricechg.AssignValueColor(Color.WHITE);
#
#####end custom quote.
Daily Price change 5 trading days (1 week) ago:
#####begin custom quote: -Day 5#
# Shows gain or loss 5 trading days ago for an equity or index.
# GREEN = Gain, RED = Loss.
# Use to customize a column in MarketWatch Quotes or Stock Hacker Scans.
# Paste this code into 1 of the 19 custom fields.
#
# by John Latrobe
# revised 11/04/13
#
DEF price = FundamentalType.CLOSE;
DEF priceday = Fundamental(price, Period = AggregationPeriod.DAY);
#
PLOT pricechg = priceday[5] - priceday[6];
AssignBackgroundColor(if pricechg > 0 then Color.DARK_GREEN else if pricechg < 0 then Color.DARK_RED else Color.CURRENT);
pricechg.AssignValueColor(Color.WHITE);
#
#####end custom quote.
Weekly Price change for past week (last 5 trading days):
#####begin custom quote: -Wk 1#
# Shows gain or loss last 5 trading days for an equity or index.
# GREEN = Gain, RED = Loss.
# Use to customize a column in MarketWatch Quotes or Stock Hacker Scans.
# Paste this code into 1 of the 19 custom fields.
#
# by John Latrobe
# revised 11/04/13
#
DEF price = FundamentalType.CLOSE;
DEF priceday = Fundamental(price, Period = AggregationPeriod.DAY);
#
PLOT pricechg = priceday[1] - priceday[6];
AssignBackgroundColor(if pricechg > 0 then Color.DARK_GREEN else if pricechg < 0 then Color.DARK_RED else Color.CURRENT);
pricechg.AssignValueColor(Color.YELLOW);
#
#####end custom quote.
Weekly Price change 2 weeks ago (trading days -10 thru -6):
#####begin custom quote: -Wk 2#
# Shows gain or loss for week ending 6 trading days ago (days -10 thru -6) for an equity or index.
# GREEN = Gain, RED = Loss.
# Use to customize a column in MarketWatch Quotes or Stock Hacker Scans.
# Paste this code into 1 of the 19 custom fields.
#
# by John Latrobe
# revised 11/04/13
#
DEF price = FundamentalType.CLOSE;
DEF priceday = Fundamental(price, Period = AggregationPeriod.DAY);
#
PLOT pricechg = priceday[6] - priceday[11];
AssignBackgroundColor(if pricechg > 0 then Color.DARK_GREEN else if pricechg < 0 then Color.DARK_RED else Color.CURRENT);
pricechg.AssignValueColor(Color.YELLOW);
#
#####end custom quote.
Weekly Price change 3 weeks ago (trading days -15 thru -11):
#####begin custom quote: -Wk 3#
# Shows gain or loss for week ending 11 trading days ago (days -15 thru -11) for an equity or index.
# GREEN = Gain, RED = Loss.
# Use to customize a column in MarketWatch Quotes or Stock Hacker Scans.
# Paste this code into 1 of the 19 custom fields.
#
# by John Latrobe
# revised 11/04/13
#
DEF price = FundamentalType.CLOSE;
DEF priceday = Fundamental(price, Period = AggregationPeriod.DAY);
#
PLOT pricechg = priceday[11] - priceday[16];
AssignBackgroundColor(if pricechg > 0 then Color.DARK_GREEN else if pricechg < 0 then Color.DARK_RED else Color.CURRENT);
pricechg.AssignValueColor(Color.YELLOW);
#
#####end custom quote.
Weekly Price change 4 weeks ago (trading days -20 thru -16):
#####begin custom quote: -Wk 4#
# Shows gain or loss for week ending 16 trading days ago (days -20 thru -16) for an equity or index.
# GREEN = Gain, RED = Loss.
# Use to customize a column in MarketWatch Quotes or Stock Hacker Scans.
# Paste this code into 1 of the 19 custom fields.
#
# by John Latrobe
# revised 11/04/13
#
DEF price = FundamentalType.CLOSE;
DEF priceday = Fundamental(price, Period = AggregationPeriod.DAY);
#
PLOT pricechg = priceday[16] - priceday[21];
AssignBackgroundColor(if pricechg > 0 then Color.DARK_GREEN else if pricechg < 0 then Color.DARK_RED else Color.CURRENT);
pricechg.AssignValueColor(Color.YELLOW);
#
#####end custom quote.
Monthly Price change for past month (last 21 trading days):
#####begin custom quote: -Mo 1
#
# Shows gain or loss for past month (trading days -21 thru -1) for an equity or index.
# -Mo 2 would use trading days -42 thru -22, etc.
# GREEN = Gain, RED = Loss.
# Use to customize a column in MarketWatch Quotes or Stock Hacker Scans.
# Paste this code into 1 of the 19 custom fields.
#
# by John Latrobe
# revised 11/04/13
#
DEF price = FundamentalType.CLOSE;
DEF priceday = Fundamental(price, Period = AggregationPeriod.DAY);
#
PLOT pricechg = priceday[1] - priceday[22];
AssignBackgroundColor(if pricechg > 0 then Color.DARK_GREEN else if pricechg < 0 then Color.DARK_RED else Color.CURRENT);
pricechg.AssignValueColor(Color.WHITE);
#
#####end custom quote.
#
# Shows gain or loss for past month (trading days -21 thru -1) for an equity or index.
# -Mo 2 would use trading days -42 thru -22, etc.
# GREEN = Gain, RED = Loss.
# Use to customize a column in MarketWatch Quotes or Stock Hacker Scans.
# Paste this code into 1 of the 19 custom fields.
#
# by John Latrobe
# revised 11/04/13
#
DEF price = FundamentalType.CLOSE;
DEF priceday = Fundamental(price, Period = AggregationPeriod.DAY);
#
PLOT pricechg = priceday[1] - priceday[22];
AssignBackgroundColor(if pricechg > 0 then Color.DARK_GREEN else if pricechg < 0 then Color.DARK_RED else Color.CURRENT);
pricechg.AssignValueColor(Color.WHITE);
#
#####end custom quote.
Subscribe to:
Posts (Atom)