12/20/13
TastyTrade Game Changers has done it again. I've been wanting to plot IV Rank but it seemed way too difficult. It turns out that the plot for IV Rank looks just like the plot for ImpVolatility; only the scale is different. Duh! (Actually, want I really want is a weighted plot. Maybe later.) They threw some threshold lines on it, slapped on some labels, and even sprinkled on a few SD move labels to spice it up. Of course, I had to hot rod it a bit.

The first change you'll see right away is the color scheme. TT likes to use green when something/anything is up and red when it's down. However, my ADD brain likes consistency. Since TOS uses green to indicate a debit (buy) and red to indicate a credit (sell), I like my study indicators to show the same. So when TT's study is signalling green, my mind is thinking buy, not sell. But 90% IV Rank is a bad time to buy, so I reversed green and red so that my study is signalling red. Now, my brain doesn't get confused since red means sell.
Other small changes
- Added a second IV Rank for a shorter time frame with on/off toggle
- Round off IV Rank percentages
- Added toggle to invert colors back to TT's style
- Modified plot names within the labels
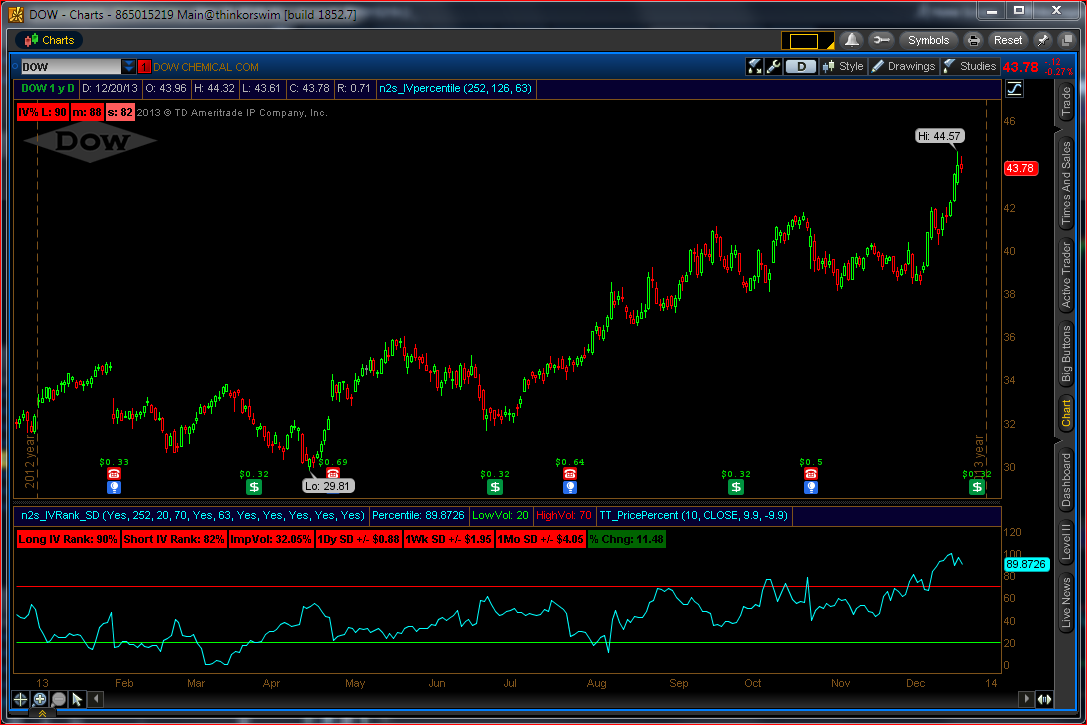
Here's what it looks like with just my new study. I left my old IV Rank study on the top for comparison but I moved the Price Percent study down to the lower window.
Here's DOW:
Here's ADSK:

And Here's TOL:

#####Begin study: n2s_IVRank_SD
#hint: From TastyTrade. Plots IV Percentile with the following labels: long-term IV Rank, short-term IV Rank, Imp Vol, and expected SD moves for 1 day, 1 week, and 1 month.
# from TastyTrade Game Changers 12/19/13
# modified by John Latrobe 12/20/13
declare lower;
declare hide_on_intraday;
#IVPercentile
def vol = imp_volatility();
input DisplayIVPercentile = yes;
input TimePeriod = 252;
input LowVolLimit = 20;
input HighVolLimit = 70;
input DisplayShorterTerm = yes;
input ShortTimePeriod = 63;
input DisplayImpVolatility= yes;
input DisplayDaily1StandardDev = yes;
input DisplayWeekly1StandardDev = yes;
input DisplayMonthly1StandardDev = yes;
input InvertRedGreen = yes;
def data = if !isNaN(vol) then vol else vol[-1];
def hi = highest(data, TimePeriod);
def lo = lowest(data, TimePeriod);
def ShortHi = highest(data, ShortTimePeriod);
def ShortLo = lowest(data, ShortTimePeriod);
plot Percentile = (data - lo) / (hi - lo) * 100;
def lowend = Percentile < LowVolLimit;
def highend = Percentile > HighVolLimit;
def sPercentile = (data - ShortLo) / (ShortHi - ShortLo) * 100;
def ShortLowend = sPercentile < LowVolLimit;
def ShortHighend = sPercentile > HighVolLimit;
DefineGlobalColor("lowcolor", if InvertRedGreen then color.green else color.red);
DefineGlobalColor("Shortlowcolor", if InvertRedGreen then color.green else color.red);
DefineGlobalColor("highcolor", if InvertRedGreen then color.red else color.green);
DefineGlobalColor("Shorthighcolor", if InvertRedGreen then color.red else color.green);
#Labels
addlabel(DisplayIVPercentile , concat("Long IV Rank: ",aspercent(round(Percentile /100, 2))), if lowend then GlobalColor("lowcolor") else if highend then GlobalColor("highcolor") else color.yellow);
addlabel(DisplayShorterTerm , concat("Short IV Rank: ",aspercent(round(sPercentile /100, 2))), if shortlowend then GlobalColor("Shortlowcolor") else if shorthighend then GlobalColor("Shorthighcolor") else color.yellow);
addlabel(DisplayImpVolatility, concat("ImpVol: ",aspercent(vol)), if lowend then GlobalColor("lowcolor") else if highend then GlobalColor("highcolor") else color.yellow);
def ImpPts = (vol / Sqrt(252)) * close;
AddLabel(DisplayDaily1StandardDev , Concat("1Dy SD +/- $", Astext( ImpPts, NumberFormat.TWO_DECIMAL_PLACES)), if lowend then GlobalColor("lowcolor") else if highend then GlobalColor("highcolor") else color.yellow);
def ImpPts2 = (vol / Sqrt(52)) * close;
AddLabel(DisplayWeekly1StandardDev, Concat("1Wk SD +/- $", Astext( ImpPts2, NumberFormat.TWO_DECIMAL_PLACES)), if lowend then GlobalColor("lowcolor") else if highend then GlobalColor("highcolor") else color.yellow);
def ImpPts3 = (vol / Sqrt(12)) * close;
AddLabel(DisplayMonthly1StandardDev, Concat("1Mo SD +/- $", Astext( ImpPts3, NumberFormat.TWO_DECIMAL_PLACES)), if lowend then GlobalColor("lowcolor") else if highend then GlobalColor("highcolor") else color.yellow);
plot LowVol = LowVolLimit;
plot HighVol = HighVolLimit;
LowVol.SetDefaultColor(GetColor(6));
HighVol.SetDefaultColor(GetColor(5));
John - The hot rodding you've done on this makes sense. The term delineation of the Long/Short Rank adds helpful perpective. What lead you to use 63?
ReplyDeletethanks for sharing!
Matt
Since there are roughly 21 trading days per month, 63 = 3 months. 1 month seemed too short term and 6 months too long.
DeleteReally nice work
ReplyDeleteGood effort. % chng label is not included in the above code
ReplyDeleteThanks. Here's the code for the label:
Deletehttp://hdtraders.blogspot.com/2013/10/thinkscript-price-percent-chart-label.html
Thank you so much !!!
ReplyDeleteNice work on the color reversal, but for you 3 months is short term?
ReplyDeleteIs there a way to just add the labels and not plot the actual chart as well. Thanks
ReplyDeleteYou can uncheck the plot box in the study properties.
Delete