Showing posts with label ThinkScript. Show all posts

Tuesday, February 18, 2014

SLM Ribbon

The TastyTrade SLM Ribbon is a study set consisting of 3 exponential moving averages: 8, 13, and 21 days.

  • Bullish open signal:
    • 8-day EMA cross above the 13-day EMA
    • 13-day EMA above 21-day EMA
    • Open above 8-day EMA (more conservatively: complete candlestick above 8-day)
  • Bearish close signal:
    • Close below 13-day EMA
    • or, 8-day EMA cross below 13-day


Friday, December 20, 2013

TOS Tip: IV Rank plot/labels with SD expected moves

12/20/13

TastyTrade Game Changers has done it again. I've been wanting to plot IV Rank but it seemed way too difficult. It turns out that the plot for IV Rank looks just like the plot for ImpVolatility; only the scale is different. Duh! (Actually, want I really want is a weighted plot. Maybe later.) They threw some threshold lines on it, slapped on some labels, and even sprinkled on a few SD move labels to spice it up. Of course, I had to hot rod it a bit.


Tuesday, December 10, 2013

Custom Column: Days Until Earnings

12/10/13


This custom quote displays the number of days until earnings (shown above in the last column). If earnings are after market close then it adds .5 to the number; otherwise, it ends in .0 when earnings are before market open.

Monday, November 4, 2013

thinkScript: Custom Quote - Strength or Weakness Indicator

Updated 11/04/13

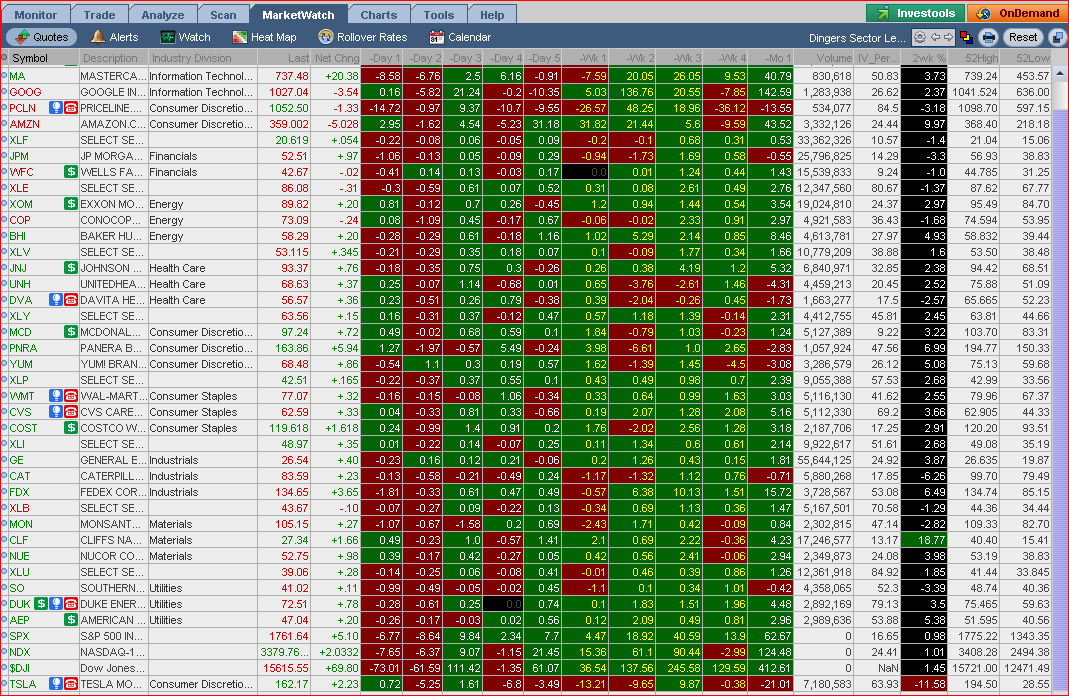
Use this custom quote to highlight stocks showing strength or weakness. '2wk %' will turn green when a stock has a 10% gain in 2 weeks, and turn red for a 10% loss.

Here's how it looks if you use the default black background:

and here's how it looks with the metal background:

Instructions for using this code can be found here: TOS Tip: Custom Quotes


####begin custom quote: 2wk %
#
# Displays the greater up or down price change over the last 2 weeks. 10% or greater = Green. -10% or less = Red.
#
# by John Latrobe
# revised 11/04/13
#
# length is # of trading days. 10 = 2 weeks.
def length = 10;
def price = FundamentalType.CLOSE;
def pricePercentUP = 10.0;
def pricePercentDOWN = -10.0;
#
def priceday = Fundamental(price, period = aggregationPeriod.DAY);
def high = Highest(priceday[1], length);
def low = Lowest(priceday[1], length);
def PcntChHigh = 100 * (priceday/high -1);
def PcntChLow = 100 * (priceday/low -1);
#
plot PercentChg = if(AbsValue(PcntChHigh) >= AbsValue(PcntChLow), Round(PcntChHigh, 2), Round(PcntChlow, 2));
AssignBackgroundColor(if PercentChg >= pricePercentUP then Color.DARK_GREEN else if PercentChg <= pricePercentDOWN then Color.DARK_RED else Color.CURRENT);
PercentChg.AssignValueColor(color.WHITE);
#
#####end quote.

thinkScript: Custom Quote - Daily/Weekly/Monthly Gain or Loss

Updated 11/04/13

Instructions for using this code can be found here: TOS Tip: Custom Quotes

Daily Price change 1 trading day ago:

#####begin custom quote: -Day 1
#
# Shows gain or loss 1 trading day ago for an equity or index.
# GREEN = Gain, RED = Loss.
# Use to customize a column in MarketWatch Quotes or Stock Hacker Scans.
# Paste this code into 1 of the 19 custom fields.
#
# by John Latrobe
# revised 11/04/13
#
DEF price = FundamentalType.CLOSE;
DEF priceday = Fundamental(price, Period = AggregationPeriod.DAY);
#
PLOT pricechg = priceday[1] - priceday[2];
AssignBackgroundColor(if pricechg > 0 then Color.DARK_GREEN else if pricechg < 0 then Color.DARK_RED else Color.CURRENT);
pricechg.AssignValueColor(Color.WHITE);
#
#####end custom quote.

Daily Price change 2 trading days ago:

#####begin custom quote: -Day 2
#
# Shows gain or loss 2 trading days ago for an equity or index.
# GREEN = Gain, RED = Loss.
# Use to customize a column in MarketWatch Quotes or Stock Hacker Scans.
# Paste this code into 1 of the 19 custom fields.
#
# by John Latrobe
# revised 11/04/13
#
DEF price = FundamentalType.CLOSE;
DEF priceday = Fundamental(price, Period = AggregationPeriod.DAY);
#
PLOT pricechg = priceday[2] - priceday[3];
AssignBackgroundColor(if pricechg > 0 then Color.DARK_GREEN else if pricechg < 0 then Color.DARK_RED else Color.CURRENT);
pricechg.AssignValueColor(Color.WHITE);
#
#####end custom quote.

Daily Price change 3 trading days ago:

#####begin custom quote: -Day 3
#
# Shows gain or loss 3 trading days ago for an equity or index.
# GREEN = Gain, RED = Loss.
# Use to customize a column in MarketWatch Quotes or Stock Hacker Scans.
# Paste this code into 1 of the 19 custom fields.
#
# by John Latrobe
# revised 11/04/13
#
DEF price = FundamentalType.CLOSE;
DEF priceday = Fundamental(price, Period = AggregationPeriod.DAY);
#
PLOT pricechg = priceday[3] - priceday[4];
AssignBackgroundColor(if pricechg > 0 then Color.DARK_GREEN else if pricechg < 0 then Color.DARK_RED else Color.CURRENT);
pricechg.AssignValueColor(Color.WHITE);
#
#####end custom quote.

Daily Price change 4 trading days ago:

#####begin custom quote: -Day 4
#
# Shows gain or loss 4 trading days ago for an equity or index.
# GREEN = Gain, RED = Loss.
# Use to customize a column in MarketWatch Quotes or Stock Hacker Scans.
# Paste this code into 1 of the 19 custom fields.
#
# by John Latrobe
# revised 11/04/13
#
DEF price = FundamentalType.CLOSE;
DEF priceday = Fundamental(price, Period = AggregationPeriod.DAY);
#
PLOT pricechg = priceday[4] - priceday[5];
AssignBackgroundColor(if pricechg > 0 then Color.DARK_GREEN else if pricechg < 0 then Color.DARK_RED else Color.CURRENT);
pricechg.AssignValueColor(Color.WHITE);
#
#####end custom quote.

Daily Price change 5 trading days (1 week) ago:

#####begin custom quote: -Day 5
#
# Shows gain or loss 5 trading days ago for an equity or index.
# GREEN = Gain, RED = Loss.
# Use to customize a column in MarketWatch Quotes or Stock Hacker Scans.
# Paste this code into 1 of the 19 custom fields.
#
# by John Latrobe
# revised 11/04/13
#
DEF price = FundamentalType.CLOSE;
DEF priceday = Fundamental(price, Period = AggregationPeriod.DAY);
#
PLOT pricechg = priceday[5] - priceday[6];
AssignBackgroundColor(if pricechg > 0 then Color.DARK_GREEN else if pricechg < 0 then Color.DARK_RED else Color.CURRENT);
pricechg.AssignValueColor(Color.WHITE);
#
#####end custom quote.

Weekly Price change for past week (last 5 trading days):

#####begin custom quote: -Wk 1
#
# Shows gain or loss last 5 trading days for an equity or index.
# GREEN = Gain, RED = Loss.
# Use to customize a column in MarketWatch Quotes or Stock Hacker Scans.
# Paste this code into 1 of the 19 custom fields.
#
# by John Latrobe
# revised 11/04/13
#
DEF price = FundamentalType.CLOSE;
DEF priceday = Fundamental(price, Period = AggregationPeriod.DAY);
#
PLOT pricechg = priceday[1] - priceday[6];
AssignBackgroundColor(if pricechg > 0 then Color.DARK_GREEN else if pricechg < 0 then Color.DARK_RED else Color.CURRENT);
pricechg.AssignValueColor(Color.YELLOW);
#
#####end custom quote.

Weekly Price change 2 weeks ago (trading days -10 thru -6):

#####begin custom quote: -Wk 2
#
# Shows gain or loss for week ending 6 trading days ago (days -10 thru -6) for an equity or index.
# GREEN = Gain, RED = Loss.
# Use to customize a column in MarketWatch Quotes or Stock Hacker Scans.
# Paste this code into 1 of the 19 custom fields.
#
# by John Latrobe
# revised 11/04/13
#
DEF price = FundamentalType.CLOSE;
DEF priceday = Fundamental(price, Period = AggregationPeriod.DAY);
#
PLOT pricechg = priceday[6] - priceday[11];
AssignBackgroundColor(if pricechg > 0 then Color.DARK_GREEN else if pricechg < 0 then Color.DARK_RED else Color.CURRENT);
pricechg.AssignValueColor(Color.YELLOW);
#
#####end custom quote.

Weekly Price change 3 weeks ago (trading days -15 thru -11):

#####begin custom quote: -Wk 3
#
# Shows gain or loss for week ending 11 trading days ago (days -15 thru -11) for an equity or index.
# GREEN = Gain, RED = Loss.
# Use to customize a column in MarketWatch Quotes or Stock Hacker Scans.
# Paste this code into 1 of the 19 custom fields.
#
# by John Latrobe
# revised 11/04/13
#
DEF price = FundamentalType.CLOSE;
DEF priceday = Fundamental(price, Period = AggregationPeriod.DAY);
#
PLOT pricechg = priceday[11] - priceday[16];
AssignBackgroundColor(if pricechg > 0 then Color.DARK_GREEN else if pricechg < 0 then Color.DARK_RED else Color.CURRENT);
pricechg.AssignValueColor(Color.YELLOW);
#
#####end custom quote.

Weekly Price change 4 weeks ago (trading days -20 thru -16):

#####begin custom quote: -Wk 4
#
# Shows gain or loss for week ending 16 trading days ago (days -20 thru -16) for an equity or index.
# GREEN = Gain, RED = Loss.
# Use to customize a column in MarketWatch Quotes or Stock Hacker Scans.
# Paste this code into 1 of the 19 custom fields.
#
# by John Latrobe
# revised 11/04/13
#
DEF price = FundamentalType.CLOSE;
DEF priceday = Fundamental(price, Period = AggregationPeriod.DAY);
#
PLOT pricechg = priceday[16] - priceday[21];
AssignBackgroundColor(if pricechg > 0 then Color.DARK_GREEN else if pricechg < 0 then Color.DARK_RED else Color.CURRENT);
pricechg.AssignValueColor(Color.YELLOW);
#
#####end custom quote.

Monthly Price change for past month (last 21 trading days):

#####begin custom quote: -Mo 1
#
# Shows gain or loss for past month (trading days -21 thru -1) for an equity or index.
# -Mo 2 would use trading days -42 thru -22, etc.
# GREEN = Gain, RED = Loss.
# Use to customize a column in MarketWatch Quotes or Stock Hacker Scans.
# Paste this code into 1 of the 19 custom fields.
#
# by John Latrobe
# revised 11/04/13
#
DEF price = FundamentalType.CLOSE;
DEF priceday = Fundamental(price, Period = AggregationPeriod.DAY);
#
PLOT pricechg = priceday[1] - priceday[22];
AssignBackgroundColor(if pricechg > 0 then Color.DARK_GREEN else if pricechg < 0 then Color.DARK_RED else Color.CURRENT);
pricechg.AssignValueColor(Color.WHITE);
#
#####end custom quote.

Sunday, October 27, 2013

thinkScript: Price Percent chart label

A useful indicator or strength or weakness in an equity is when the price moves up or down 10% in 2 weeks. For indexes this change is 5%.


This Chart label compares the current price with the high and low for the past specified period (default is 2 weeks) and displays the maximum price change. When the default threshold of +/- 5% is reached the label will turn red for a loss and green for a gain.


####begin study: TT_PricePercent
#
# Hint: From TastyTrade. Takes the high and low close for the specified period and compares to the current. The greater change is displayed as a percentage in a label.
#
# length is # of trading days. 10 = 2 weeks.
input length = 10;
input price = FundamentalType.CLOSE;
input pricePercentUP = 5.0;
input pricePercentDOWN = -5.0;
#
def priceday = Fundamental(price, period = aggregationPeriod.DAY);
def high = Highest(priceday[1], length);
def low = Lowest(priceday[1], length);
def PcntChHigh = 100 * (priceday/high -1);
def PcntChLow = 100 * (priceday/low -1);
def PercentChg = if(AbsValue(PcntChHigh) >= AbsValue(PcntChLow), Round(PcntChHigh, 2), Round(PcntChlow, 2));
#
AddLabel(1, Concat ("% Chng: ", PercentChg),if percentChg >= pricePercentUP then color.DARK_GREEN else if percentChg <= pricePercentDOWN then color.RED else color.GRAY);
#
#####end study.

Monday, October 14, 2013

TOS Tip: Custom Quotes

Thinkorswim allows 19 custom quotes for use as customized columns. They can be used on the Trade tab, Stock Hacker Scans, and Market Watch Quotes.


In order to use the Custom Quotes you must first be on one of the screens that support them. Right-click on any column heading and select Customize.


Type 'custom' in the search box that says 'Lookup a column...' This will filter out all but your custom columns, even ones that you rename.


Click the scroll icon for the custom column you want to edit. Click on the thinkScript Editor tab and delete any code that exists. Copy the desired code and paste it on line 1. Fill in the Column name to match.


After customizing each column they must be added to the current display set. You'll probably have to remove some of the existing columns to make room. Make sure that you save the Workspace so that your customizations are easily recalled.