Updated 11/04/13
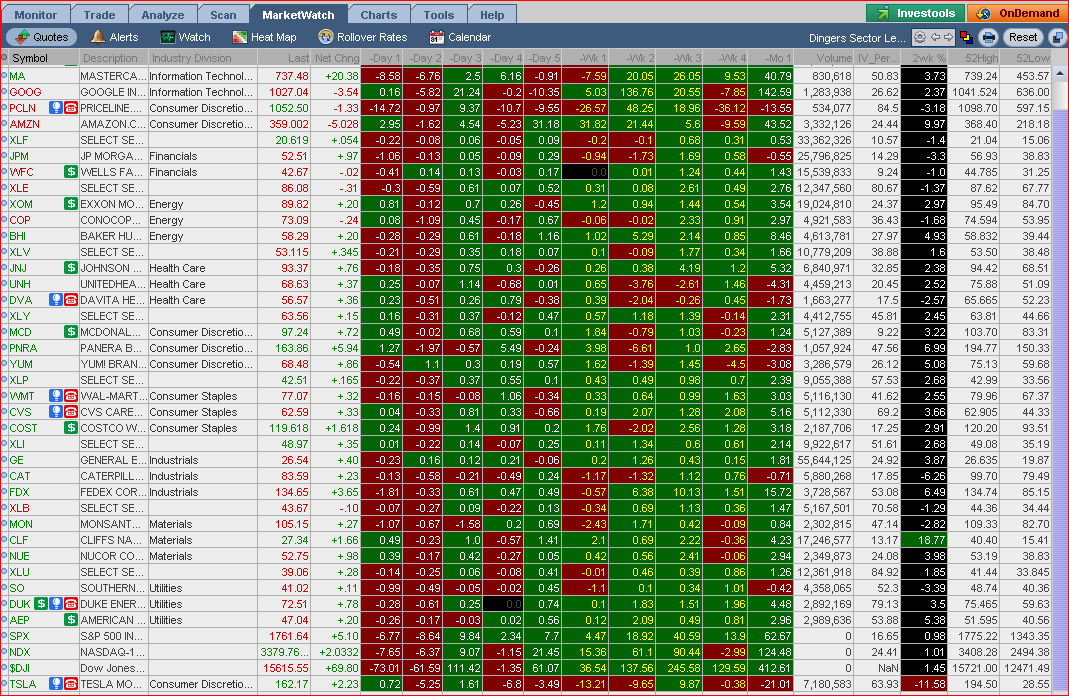
Use this custom quote to highlight stocks showing strength or weakness. '2wk %' will turn green when a stock has a 10% gain in 2 weeks, and turn red for a 10% loss.Here's how it looks if you use the default black background:

and here's how it looks with the metal background:
Instructions for using this code can be found here: TOS Tip: Custom Quotes
####begin custom quote: 2wk %
#
# Displays the greater up or down price change over the last 2 weeks. 10% or greater = Green. -10% or less = Red.
#
# by John Latrobe
# revised 11/04/13
#
# length is # of trading days. 10 = 2 weeks.
def length = 10;
def price = FundamentalType.CLOSE;
def pricePercentUP = 10.0;
def pricePercentDOWN = -10.0;
#
def priceday = Fundamental(price, period = aggregationPeriod.DAY);
def high = Highest(priceday[1], length);
def low = Lowest(priceday[1], length);
def PcntChHigh = 100 * (priceday/high -1);
def PcntChLow = 100 * (priceday/low -1);
#
plot PercentChg = if(AbsValue(PcntChHigh) >= AbsValue(PcntChLow), Round(PcntChHigh, 2), Round(PcntChlow, 2));
AssignBackgroundColor(if PercentChg >= pricePercentUP then Color.DARK_GREEN else if PercentChg <= pricePercentDOWN then Color.DARK_RED else Color.CURRENT);
PercentChg.AssignValueColor(color.WHITE);
#
#####end quote.
No comments:
Post a Comment