9/30/13 -Open
With JCP down -35% in the past 2 weeks, and dipping below $9 for the first time in 13 years it's time to buy into weakness.

The IV is 101% with a recent range of 48-116%. That places the current IV in the 78%-tile (101-48)/(116-48). So we'll collect some of the inflated premiums in the puts and use the credit to help finance a LEAP.
Update: 11/7/13
JCP continued to fall and hit a low of 6.24 before rebounding. It's toying with out short position so let's roll it to Dec. Normally we wait until closer to expiration to buy back shorts but I don't want to have to babysit it next week.
- JCP @8.09
- BTC +10 Nov 8 P
- STO -10 Dec 8 P
- Credit = 0.64
- TCOT = 0.48 * 10 = $480cr
Update: 11/22/13
How's my position doing so far? Looking at my position statement and the risk profile it shows that I am up $170.

However, since I've already collected $480 does that mean it'll cost me $310 to close right now? No way. If I close my entire position TOS shows about a $20 debit, leaving me with $460, so what's the deal?
TOS only considers current positions when it calculates P/L and risk so it is ignoring any previous trades like the Nov/Dec 8 put roll. Ideally it would be nice to be able to adjust the cost basis, or even add closed trades in the analyzer. Since we can't, I'll add a simulated trade to represent the adjustment to my cost basis.
First, I need to calculate my true cost basis. My two trades, the opening and the roll, are shown below. The order history shows the order credit/debit, and the trade history shows credit/debit for each option in the order.

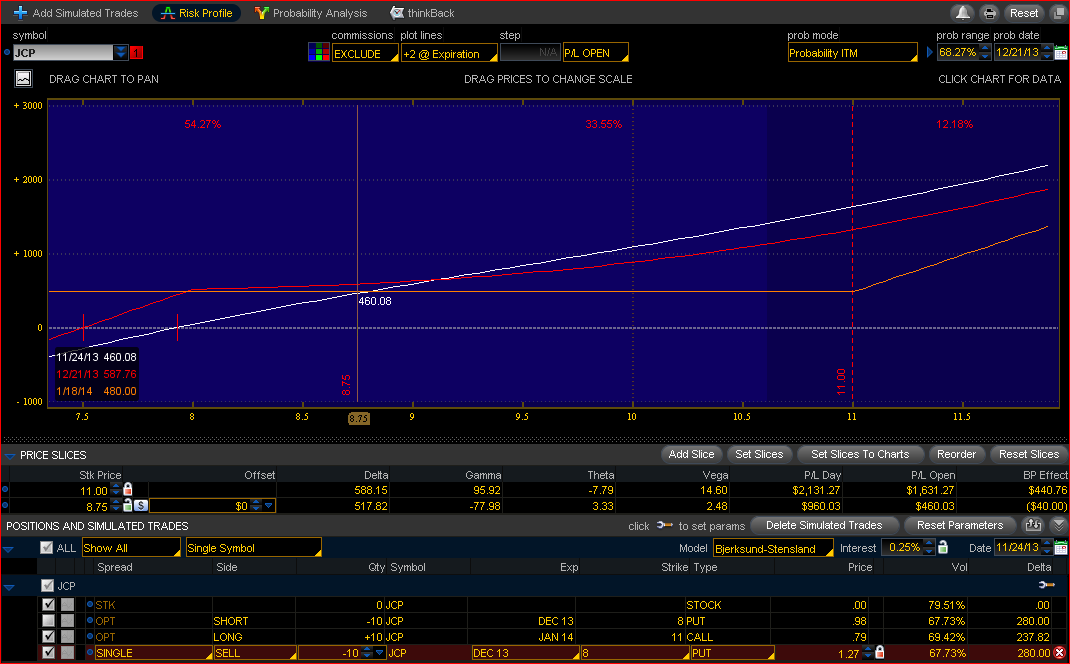
I currently long the Jan14 11C and short the Dec13 8P. Since my long Jan 11C position hasn't changed since I initiated the position I only need to focus on the 8P. TOS looks at the .98 that I collected for the Dec 8P as my cost basis and ignores my previous Nov 8P that I shorted and then bought back. I can even look at the risk profile and isolate the Dec 8P.

Here, I unchecked my long position and left the short position in the graph. You can see my max profit to be $980 which corresponds exactly to the .98 that TOS shows I collected in the trade history. To see my corrected risk profile with my true cost basis I need to factor in the previous trades which are closed but still affected by bottom line.
Going back to the trade history I see I sold the Nov 8P for .63 and bought it back for .34 (ignore the credit or debit since that refers to the net order, just look for the buy or sell). That means I have an additional credit of .29 that TOS isn't accounting for. If I were to add a simulated trade for a .29 credit, my max profit would be corrected, by my risk would also be increased, which isn't accurate. Instead, I'll add a simulated trade that replaces my short Dec 8P.
I currently long the Jan14 11C and short the Dec13 8P. Since my long Jan 11C position hasn't changed since I initiated the position I only need to focus on the 8P. TOS looks at the .98 that I collected for the Dec 8P as my cost basis and ignores my previous Nov 8P that I shorted and then bought back. I can even look at the risk profile and isolate the Dec 8P.
Here, I unchecked my long position and left the short position in the graph. You can see my max profit to be $980 which corresponds exactly to the .98 that TOS shows I collected in the trade history. To see my corrected risk profile with my true cost basis I need to factor in the previous trades which are closed but still affected by bottom line.
Going back to the trade history I see I sold the Nov 8P for .63 and bought it back for .34 (ignore the credit or debit since that refers to the net order, just look for the buy or sell). That means I have an additional credit of .29 that TOS isn't accounting for. If I were to add a simulated trade for a .29 credit, my max profit would be corrected, by my risk would also be increased, which isn't accurate. Instead, I'll add a simulated trade that replaces my short Dec 8P.
- Right-click on the short position and select 'Analyze Closing Trade'
- Change the trade from Buy to Sell
- Adjust the credit to .98 + .29 = 1.27
Update: 12/21/13
JCP @8.32. The bull run ended on 12/3 with a high of 10.30 and JCP has been taking a dump ever since. Where do we stand now? Our short put expired and we are left with the Jan 11C with is only worth a few cents. At this point I will look to sell out for whatever I can get. So far I am still up .48 because of the the very profitable roll.
No comments:
Post a Comment