11/24/13
When analyzing a position with Thinkorswim's Risk Profile it isn't accurate if you modified the original trade by rolling, closing half an iron condor, etc. For example, below is the risk profile for a current position in JCP.- BTO +10 Jan14 11 C
- STO -10 Dec13 8 P

It shows I am currently up $170, with a max profit of $190 at Jan expiration if JCP stays between 8 and 11. This is confirmed by checking the closing order, which would be a debit of $20. However, TOS is ignoring my original trade and that I rolled the short puts.
Here's my original trade:
- BTO +10 Jan 11 C
- STO -10 Nov 8 P
- Debit = 0.16 * 10 = $160
- BTC +10 Nov 8 P
- STO -10 Dec 8 P
- Credit = 0.64
- TCOT = 0.48 * 10 = $480cr
First, I need to calculate my true cost basis. My two trades, the opening and the roll, are shown below. The order history shows the order credit/debit, and the trade history shows credit/debit for each option in the order.

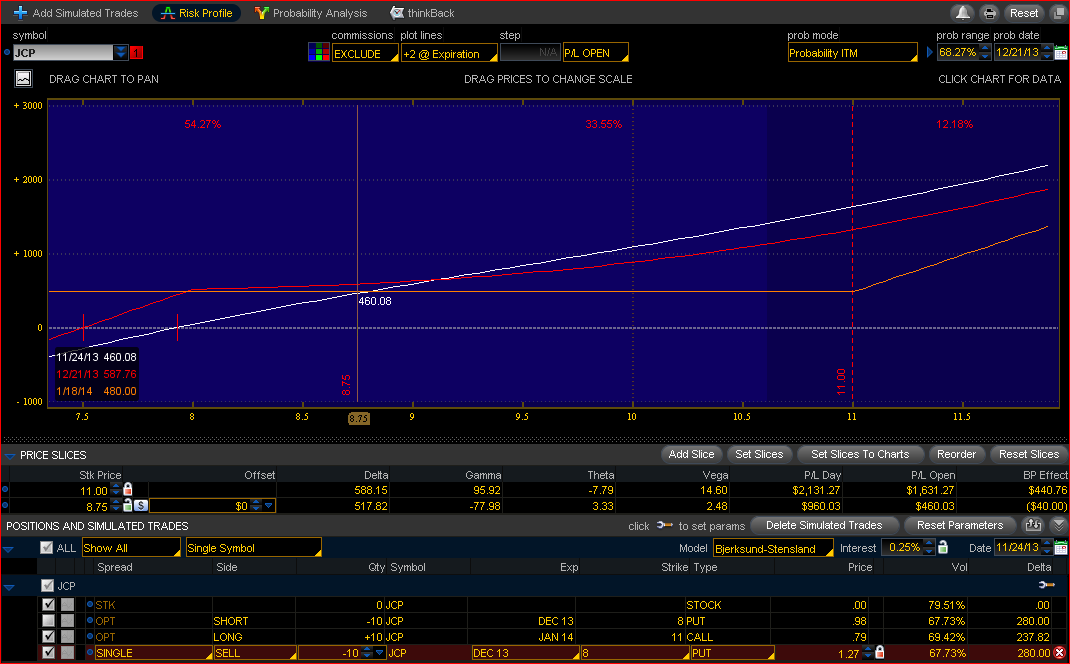
I'm currently long the Jan14 11C and short the Dec13 8P. My long Jan 11C position hasn't changed since I initiated the position so I only need to focus on the 8P. TOS looks at the .98 that I collected for the Dec 8P as my cost basis and ignores my previous Nov 8P that I shorted and then bought back. I can even look at the risk profile and isolate the Dec 8P.

Here, I unchecked my long position and left the short position in the graph. You can see my max profit to be $980 which corresponds exactly to the .98 that TOS shows I collected in the trade history. To see my corrected risk profile with my true cost basis I need to factor in the previous trades which are closed but still affect by bottom line.
Going back to the trade history I see that I sold the Nov 8P for .63 and bought it back for .34 (ignore the 'credit' or 'debit' since that refers to the net order, just look for the buy or sell). That means I have an additional credit of .29 that TOS isn't accounting for. If I were to add a simulated trade for a .29 credit, my max profit would be corrected, by my risk would also be increased, which isn't accurate. Instead, I'll add a simulated trade that replaces my short Dec 8P.
I'm currently long the Jan14 11C and short the Dec13 8P. My long Jan 11C position hasn't changed since I initiated the position so I only need to focus on the 8P. TOS looks at the .98 that I collected for the Dec 8P as my cost basis and ignores my previous Nov 8P that I shorted and then bought back. I can even look at the risk profile and isolate the Dec 8P.
Here, I unchecked my long position and left the short position in the graph. You can see my max profit to be $980 which corresponds exactly to the .98 that TOS shows I collected in the trade history. To see my corrected risk profile with my true cost basis I need to factor in the previous trades which are closed but still affect by bottom line.
Going back to the trade history I see that I sold the Nov 8P for .63 and bought it back for .34 (ignore the 'credit' or 'debit' since that refers to the net order, just look for the buy or sell). That means I have an additional credit of .29 that TOS isn't accounting for. If I were to add a simulated trade for a .29 credit, my max profit would be corrected, by my risk would also be increased, which isn't accurate. Instead, I'll add a simulated trade that replaces my short Dec 8P.
- Right-click on the short position and select 'Analyze Closing Trade'
- Change the trade from Buy to Sell
- Adjust the credit to .98 + .29 = 1.27
You can also see that my BE of 7.50 in Dec has dropped .29 compared to the first graph. This example was complicated since my resulting position wasn't a conventional spread, and I couldn't simply create a single closing order. However, the next example is much simpler.
Example 2:
Here's the risk profile for a current trade in KSS.

It shows a current profit of $73 with a max profit of $228. It also shows my BE at expiration to be 53.86. However, it's ignoring my initial position and the roll.

You can see my opening trade on 11/12 was an iron condor, and I rolled the put spread on 11/14, letting the calls expire OTM. TOS is only using the sell/buy prices for the Dec puts as my cost and ignoring all the Nov options. But since my resulting position is a conventional spread, all I need to do is create a duplicate trade and total up all my credits/debits. In this case I've collected .72 and .17 for a total of .89cr. Now I follow the same 3 steps.
- Highlight both puts, right-click, and select 'Analyze Closing Trade'
- Change the trade from Buy to Sell
- Adjust the credit to .89

Now you can see my current profit has been lowered to only $33 with a max profit of $178. Also, my BE is higher at 54.11.
If I wanted to be truly accurate, I could even adjust the price to include my commision costs. My initial trade cost $13 and so did the roll for a total of $26. Since I have 2 contracts that reduces my net credit by .13, down to .76.
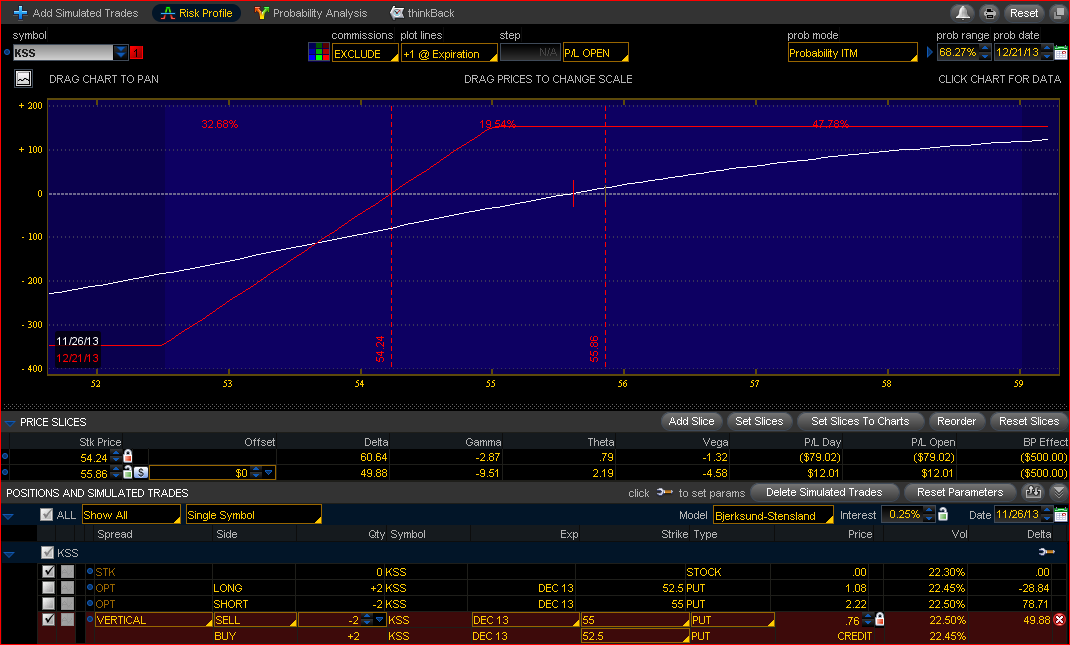
So, not considering any price movement while taking these screenshots, my current profit is actually only $12, nowhere near the $73 that TOS originally showed.
No comments:
Post a Comment